> ## Documentation Index
> Fetch the complete documentation index at: https://openrouter.ai/docs/llms.txt
> Use this file to discover all available pages before exploring further.
# Activity
> Analyze spend, request volume, tokens, and trends across your OpenRouter usage from the Activity dashboard
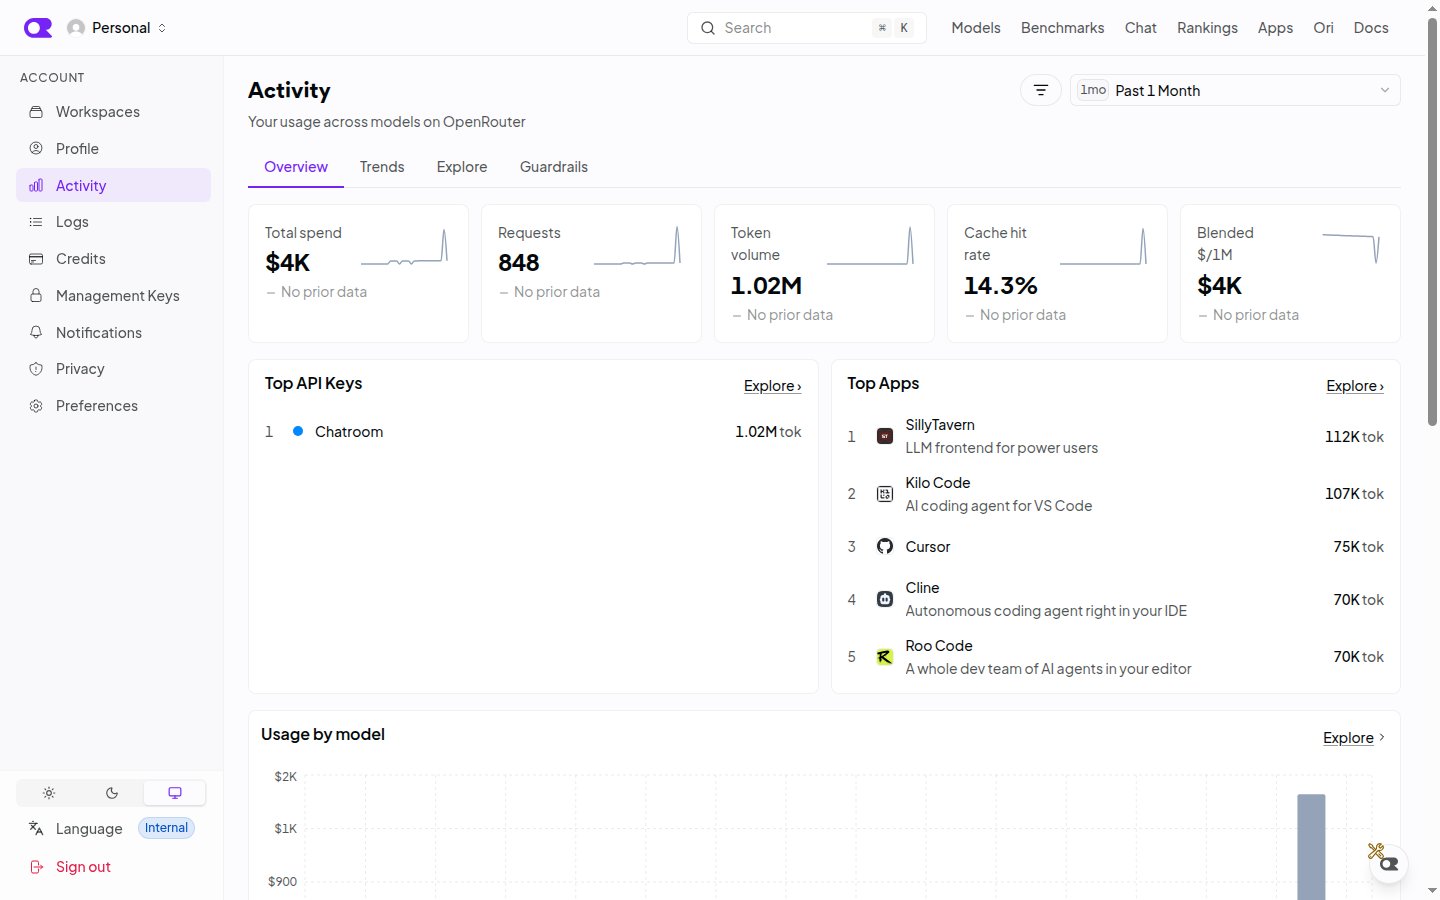
The [Activity](https://openrouter.ai/activity) page is the aggregate view of OpenRouter's observability suite. Where [Logs](/docs/guides/features/logs) lists individual generations, Activity rolls them up into spend, request, and token metrics you can slice by model, provider, API key, app, or user over any date range.
 ## Tabs
| Tab | What it shows |
| -------------- | --------------------------------------------------------------------------------------------------------------------------------------------------------------------------------------------------------------------------------------------------------------------------------------------------------------------------- |
| **Overview** | Headline metrics for the selected range: total spend, requests, token volume, blended cost per million tokens, and cache hit rate. Ranked cards list top API keys, apps, and users, alongside charts for usage by model, token breakdown (prompt, completion, reasoning), prompt caching, and usage type (credits vs BYOK). |
| **Trends** | Time series for requests, spend, or tokens, plus a "Trending" card that highlights the biggest movers versus the prior period. |
| **Explore** | A configurable chart and table builder. Pick a metric, group by one or two dimensions, choose a time rollup, and switch between bar, line, and dot plot views. |
| **Guardrails** | Guardrail activity across your organization, filterable by model, provider, or status. See [Guardrails](/docs/guides/features/guardrails). |
Every tab shares the same date range and filter state, which is stored in the URL. Switching tabs keeps your filters, so you can move from an Overview anomaly to Trends to Explore without re-entering them.
## Filtering
The filter bar accepts user, model, provider, API key, and modality (depending on the tab). Organization accounts can filter by member. From most cards you can jump directly to **View logs** or **Open in Explorer** with the same filters applied.
## Explore
Explore is the most flexible view. Its controls are:
* **Metric**: what to measure, such as spend, requests, or tokens.
* **Group** and **Subgroup**: one or two dimensions to break the metric down by, with a **Limit** and **Rank by** setting for how many series to show. Series beyond the limit are collapsed into an "Other" row.
* **Rollup**: the time bucket for the chart, or none for a flat ranking.
* **Cumulative sum**: available when a time rollup and an additive metric are selected.
You can save an Explore configuration as a named chart, visible only to you or to everyone in your organization, and reload it later from the saved charts menu.
## Exporting
Explore results can be downloaded as CSV or PDF. Exports respect the current filters and date range. For a step-by-step guide to producing usage reports grouped by API key, model, or organization member, see [Activity Export](/docs/cookbook/administration/activity-export).
## API access
The same aggregates are available programmatically with a [Management API key](/docs/guides/overview/auth/management-api-keys).
| Endpoint | Returns |
| ----------------------------------------------------------------------------------------------------------- | ------------------------------------------------------------------------------------------------------------------ |
| [`GET /api/v1/analytics/meta`](/docs/api/api-reference/analytics/get-available-analytics-metrics-and-dimensions) | The metrics, dimensions, filter operators, and granularities the query endpoint accepts. |
| [`POST /api/v1/analytics/query`](/docs/api/api-reference/analytics/query-analytics-data) | The programmatic equivalent of Explore. Pick a metric, group by dimensions, filter, and choose a time granularity. |
| [`GET /api/v1/activity`](/docs/api/api-reference/analytics/get-user-activity-grouped-by-endpoint) | Daily usage and spend grouped by model endpoint. |
For a worked example of running a cost review against the query endpoint, see [Analytics cost control](/docs/cookbook/administration/analytics-cost-control).
## Related
* [Logs](/docs/guides/features/logs): inspect the individual generations behind any number on this page.
* [Broadcast](/docs/guides/features/broadcast): send per-request traces to your own observability platform.
* [Management API Keys](/docs/guides/overview/auth/management-api-keys): programmatic access to key-level usage.
## Tabs
| Tab | What it shows |
| -------------- | --------------------------------------------------------------------------------------------------------------------------------------------------------------------------------------------------------------------------------------------------------------------------------------------------------------------------- |
| **Overview** | Headline metrics for the selected range: total spend, requests, token volume, blended cost per million tokens, and cache hit rate. Ranked cards list top API keys, apps, and users, alongside charts for usage by model, token breakdown (prompt, completion, reasoning), prompt caching, and usage type (credits vs BYOK). |
| **Trends** | Time series for requests, spend, or tokens, plus a "Trending" card that highlights the biggest movers versus the prior period. |
| **Explore** | A configurable chart and table builder. Pick a metric, group by one or two dimensions, choose a time rollup, and switch between bar, line, and dot plot views. |
| **Guardrails** | Guardrail activity across your organization, filterable by model, provider, or status. See [Guardrails](/docs/guides/features/guardrails). |
Every tab shares the same date range and filter state, which is stored in the URL. Switching tabs keeps your filters, so you can move from an Overview anomaly to Trends to Explore without re-entering them.
## Filtering
The filter bar accepts user, model, provider, API key, and modality (depending on the tab). Organization accounts can filter by member. From most cards you can jump directly to **View logs** or **Open in Explorer** with the same filters applied.
## Explore
Explore is the most flexible view. Its controls are:
* **Metric**: what to measure, such as spend, requests, or tokens.
* **Group** and **Subgroup**: one or two dimensions to break the metric down by, with a **Limit** and **Rank by** setting for how many series to show. Series beyond the limit are collapsed into an "Other" row.
* **Rollup**: the time bucket for the chart, or none for a flat ranking.
* **Cumulative sum**: available when a time rollup and an additive metric are selected.
You can save an Explore configuration as a named chart, visible only to you or to everyone in your organization, and reload it later from the saved charts menu.
## Exporting
Explore results can be downloaded as CSV or PDF. Exports respect the current filters and date range. For a step-by-step guide to producing usage reports grouped by API key, model, or organization member, see [Activity Export](/docs/cookbook/administration/activity-export).
## API access
The same aggregates are available programmatically with a [Management API key](/docs/guides/overview/auth/management-api-keys).
| Endpoint | Returns |
| ----------------------------------------------------------------------------------------------------------- | ------------------------------------------------------------------------------------------------------------------ |
| [`GET /api/v1/analytics/meta`](/docs/api/api-reference/analytics/get-available-analytics-metrics-and-dimensions) | The metrics, dimensions, filter operators, and granularities the query endpoint accepts. |
| [`POST /api/v1/analytics/query`](/docs/api/api-reference/analytics/query-analytics-data) | The programmatic equivalent of Explore. Pick a metric, group by dimensions, filter, and choose a time granularity. |
| [`GET /api/v1/activity`](/docs/api/api-reference/analytics/get-user-activity-grouped-by-endpoint) | Daily usage and spend grouped by model endpoint. |
For a worked example of running a cost review against the query endpoint, see [Analytics cost control](/docs/cookbook/administration/analytics-cost-control).
## Related
* [Logs](/docs/guides/features/logs): inspect the individual generations behind any number on this page.
* [Broadcast](/docs/guides/features/broadcast): send per-request traces to your own observability platform.
* [Management API Keys](/docs/guides/overview/auth/management-api-keys): programmatic access to key-level usage.